I always have to stop and think about this, so I just thought I would write it down so it sticks better in my brain.
If you include an interaction in your model, it means that you are interested in how the effect of those variables changes the response. For example, happiness can depend on the amount of chocolate you eat and how hungry you are. Although happiness increases with more chocolate, the effect is different if you are full or hungry (Fig1a), and vice versa (Fig1b). In Fig1b, the hungrier you are the happier you are (that’s a bit crazy), but if you eat a more chocolate you are happier than if you eat less chocolate.
So you use this when you are interested in whether the two predictor variables could be changing their effects on the response variable.
Happiness = chocolate + hunger + chocolate*hunger

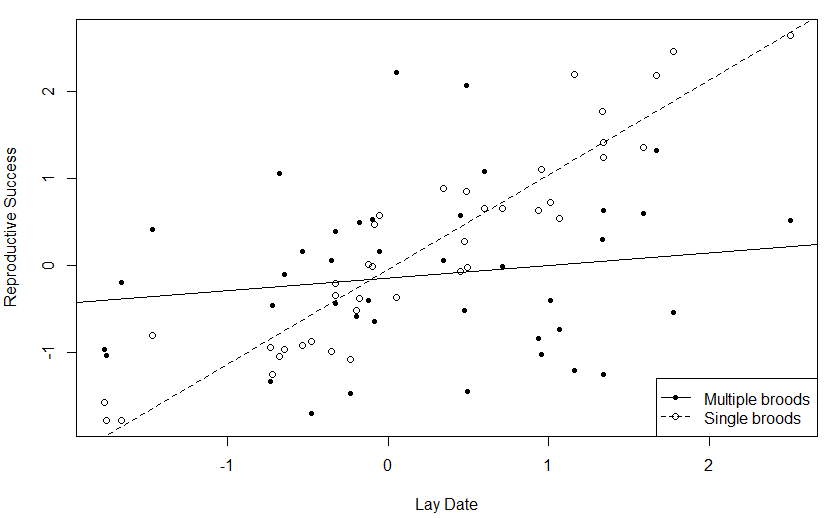
For the rest of this, I am going to use some other data I made up to work on before I start on my real data. It looks at how lay date is related to reproductive success in species which have only one or multiple broods in a breeding season. Each data point is representative of a different bird species. I made it so that lay date had a positive correlation to reproductive success for single brood species, but no correlation for multiple brooding species.
How I generated the data
xvalues = rnorm(12)
yvalues = NULL
for (n in 1:length(xvalues)) { yvalues[n] = xvalues[n] + rnorm(1, 0, 2); cat(xvalues[n], ", ", yvalues[n], "\n") }
Here, the 12 is how many data points you want (n). Also, you can set the details in the for loop rnorm(n, mean, sd).
xvalues = rnorm(12)
yvalues = NULL
for (n in 1:length(xvalues)) { yvalues[n] = xvalues[n] + rnorm(1, 0, 2); cat(xvalues[n], ", ", yvalues[n], "\n") }
Here, the 12 is how many data points you want (n). Also, you can set the details in the for loop rnorm(n, mean, sd).
I first tested a few models (just laydate, laydate and number of broods without an interaction) but not surprisingly, this model was the best by far:
Reproductive success = Laydate + broods + Laydate*broods
H2 <- lm (rep ~ laydate*broods, data=compar)
I coded number of broods as multiple=0 and single=1
Reproductive success = Laydate + broods + Laydate*broods
H2 <- lm (rep ~ laydate*broods, data=compar)
I coded number of broods as multiple=0 and single=1
From this, you can get the equation.
Reproductive success = 0.144 laydate + 0.098 #broods + 0.945 laydate*#broods
This means that the effect of laydate on reproductive success is 0.144+0.945*#broods. However, because # broods is made up of only 1 for single and 0 for multiple brooders, you can see that:
Therefore, reproductive success increases by 0.144 per change in laydate in multi-brood species, and by 1.089 per change in laydate in single-brood species. The slope estimate from the interaction is actually the difference in slopes between each brood group (1.089 - 0.144 = 0.945).
Reproductive success = 0.144 laydate + 0.098 #broods + 0.945 laydate*#broods
This means that the effect of laydate on reproductive success is 0.144+0.945*#broods. However, because # broods is made up of only 1 for single and 0 for multiple brooders, you can see that:
- For multi-brood species the effect of laydate on reproductive success is 0.144+0.945*0, which is just 0.144.
- For single-brood species the effect of laydate on reproductive success is 0.144+0.945*1, which is 1.089.
Therefore, reproductive success increases by 0.144 per change in laydate in multi-brood species, and by 1.089 per change in laydate in single-brood species. The slope estimate from the interaction is actually the difference in slopes between each brood group (1.089 - 0.144 = 0.945).
 RSS Feed
