Multiple regression fits represent our best guess at causal relationships. We guess that the predictor variables have biological effects on our response variable (although it could always be a different variable that is correlated to the response variable). However, multiple regression can only consider direct effects of each predictor, adjusting for the others, on the response variable (see Interpreting results from multiple regression for other issues).
It is possible to come up with relationships that are much more complex, where there can be causal links between variables. Path analysis is a statistical technique that can include indirect effects where one predictor affects a second predictor, which can then affect the response variable. You could also have two or more response variables that also affect each other. Pathanalysis is a subset of structural equation modelling (SEM). Inherent in SEM practice is the evaluation of fit between model expectations and observed relations in the data.
You have to remember that you can never really know if there is a causal relationship between the predictor and the response variables by using these sorts of techniques. To do that, you need to use experiments. All Path analyses and SEM does is test how well the hypothesised causal pathways fit the observed data in a modelling context.
Direct effects – these are measured by the standardized partial regression coefficient between Y and Xj, holding all other predictor variables constant. The direct effect is now the path coefficient relating Y to Xj.
Indirect effects – indirect effects are due to the correlations between Xj and the other predictors, which may in turn have direct effects on Y.
Path coefficients – can either be or depending on whether they are from an exogenous to endogenous variable, or endogenous to endogenous respectively.
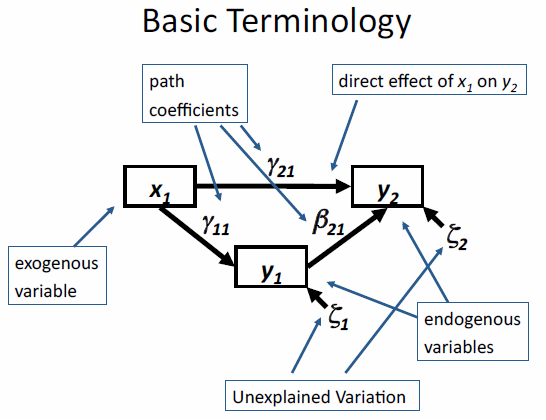
Figure taken from Lecture 1 on http://byrneslab.net/teaching/sem/ Check it out for lots of great resources. See References at the end for more details.
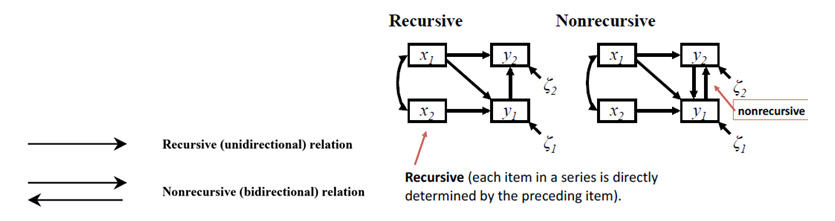
Recursive/non-recursive models – In recursive models, each item in a series is directly determined by the preceding item.
http://byrneslab.net/teaching/sem/
Saturated model - all possible paths are specified (if a model is not saturated then it represents a testable hypothesis)
More complex procedures estimate the path coefficients and the variances and covariances of the predictor variables simultaneously from the data using maximum likelihood (there are also other estimation methods available such as OLS).
More complex procedures estimate the path coefficients and the variances and covariances of the predictor variables simultaneously from the data using maximum likelihood (there are also other estimation methods available such as OLS).
The Rules of Path Coefficients
 http://byrneslab.net/teaching/sem/
 1.
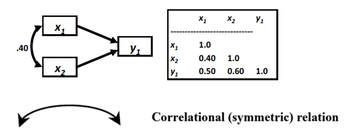
The path coefficients for unanalysed relationships (curved arrows) between exogenous variables (variables that only predict others) are their correlations (when standardised) or covariances (when unstandardized).
The path coefficients for unanalysed relationships (curved arrows) between exogenous variables (variables that only predict others) are their correlations (when standardised) or covariances (when unstandardized).
2.
When two variables are only connected through a single pathway, the coefficient for that path is just the regression coefficient (if it is a standardised regression coefficient then this is just a simple correlation).
When two variables are only connected through a single pathway, the coefficient for that path is just the regression coefficient (if it is a standardised regression coefficient then this is just a simple correlation).
http://byrneslab.net/teaching/sem/
 http://byrneslab.net/teaching/sem/
 3.
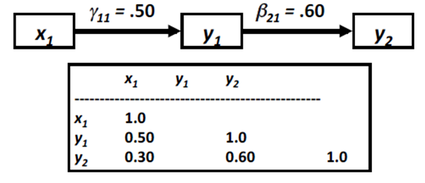
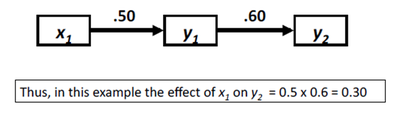
The strength of a compound path (a path that involves multiple arrows) is the product of the coefficients along that path.
The strength of a compound path (a path that involves multiple arrows) is the product of the coefficients along that path.
When these numbers do match up (when 0.3 is also the correlation between x1 and y2), then x1 and y2 are “conditionally independent”. If they don’t equal the same number, then it suggests that the true model might include a direct effect of x1 on y2.
http://byrneslab.net/teaching/sem/
4.
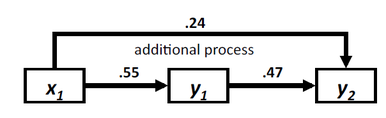
When two variables are connected by more than one causal pathway, then partial regression coefficients are calculated (rather than full regression coefficients).
5.
Coefficients from error variable paths are correlations representing unexplained paths or influences from other unmeasured forces. The error terms (error of measurement in each indicator) are denoted by the Greek letter δ (delta) and are assumed to be associated with each indicator.
6.
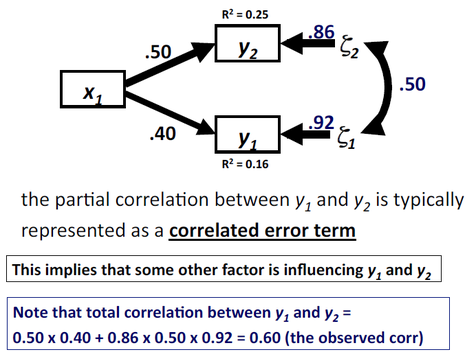
Unanalysed correlations between endogenous variables (responses) are represented by partial correlations or covariances (depending on whether standardised or not).
When two variables are connected by more than one causal pathway, then partial regression coefficients are calculated (rather than full regression coefficients).
5.
Coefficients from error variable paths are correlations representing unexplained paths or influences from other unmeasured forces. The error terms (error of measurement in each indicator) are denoted by the Greek letter δ (delta) and are assumed to be associated with each indicator.
6.
Unanalysed correlations between endogenous variables (responses) are represented by partial correlations or covariances (depending on whether standardised or not).
http://byrneslab.net/teaching/sem/
7.
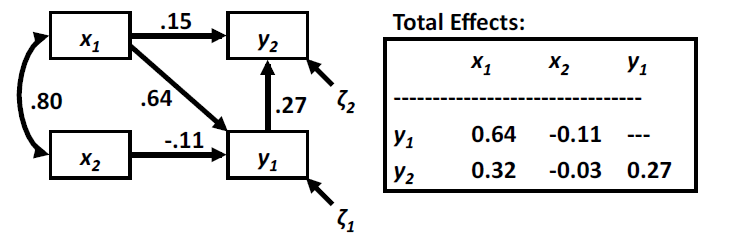
The total effect that one variable has on another equals the sum of its direct and indirect effects.
The total effect that one variable has on another equals the sum of its direct and indirect effects.
http://byrneslab.net/teaching/sem/
8.
The sum of all pathways that connect two variables (including causal and noncausal paths) adds up to the total correlation between those two variables
The sum of all pathways that connect two variables (including causal and noncausal paths) adds up to the total correlation between those two variables
References:
Nearly all figures were taken straight from Lecture 1 from “An Introduction to Structural Equation Modeling for Ecology & Evolutionary Biology”. Lots of great resources found on their website
Structural Equation Modeling and Natural Systems, James B Grace (2006) Cambridge University Press
Grace and Bollen (2005) Interpreting the Results from Multiple Regression and STructural Equation Models. Bulletin of the Ecological Society of America.
 RSS Feed
